One of the interesting things about personal finance is that we rarely know how we’re doing compared to everyone else. It’s a bit of a mystery as most people don’t share such private information.
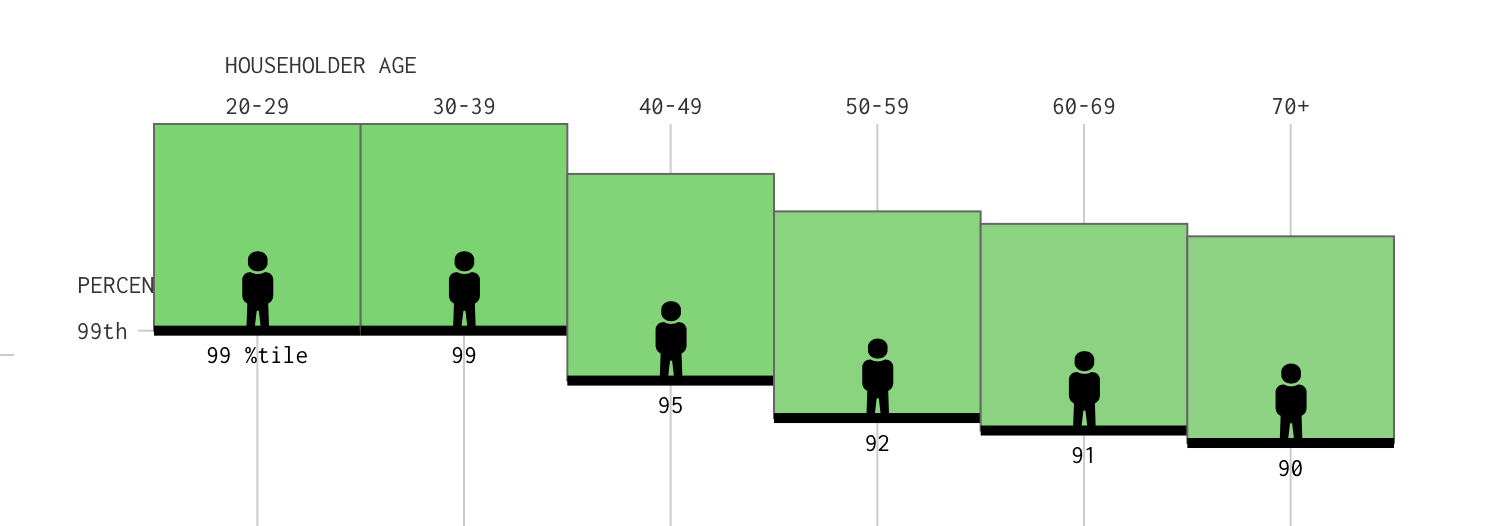
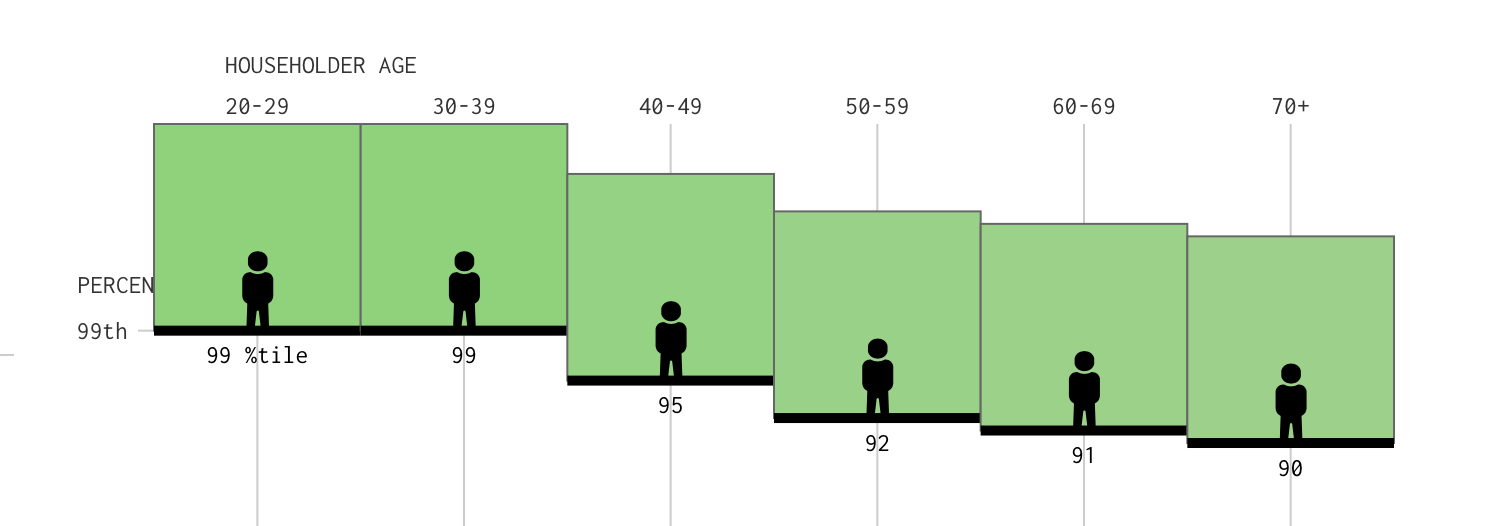
Sure, we hear plenty about billionaires in the news, but what does a typical American household actually have? And how does that change with age? My MegaCorp boss, Don, sent me this nifty interactive chart from Flowing Data that answers exactly those questions.
Check Out the Interactive Net Worth Chart Here!
The chart lets you slide through different net worth levels and see where your household ranks compared to others in your age group. It’s based on the 2025 Survey of Consumer Finances and measures net worth as total assets minus total debts.
Of course, comparing a 30-year-old just getting started with a 65-year-old approaching retirement isn’t particularly meaningful. That’s what makes this chart so interesting. You can see how wealth accumulates across different stages of life.
A few interesting findings:
- The median American net worth is $216K
- $1 million is in the Top 25%
- For Ages 60–69, median is $460K.
- For Top 5%, you’ll need $5.0 million
- For Top 1% you’ll need $16.3 million
And, as I’ve written many times, winning the retirement game isn’t about dying with the biggest pile of money. Still, it’s fun to see how you stack up with your age group.
Give the chart a try. Were you surprised by the results?
Image: FlowingData.com

