
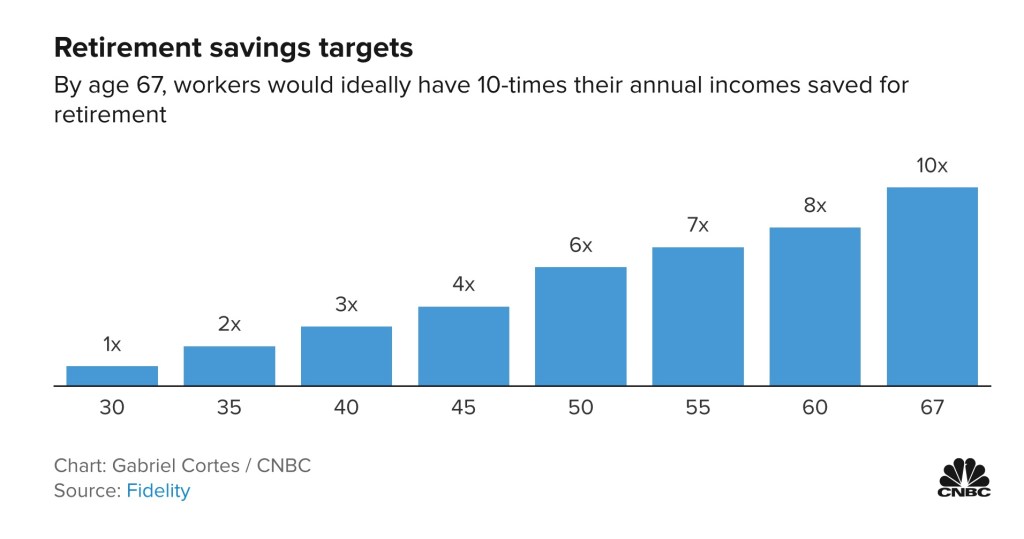
It’s as if the financial press WANTS people to be poorly prepared for a happy retirement. This chart from CNBC – dubiously thought of as a business channel – suggests the amount of savings people should have at different ages before retirement. A friend sent it to me a while ago and I think it’s simply terrible.
First, the chart starts with the frequent financial planning mistake of assuming what you MAKE today is a proxy for what you will SPEND in retirement. I know people who spend LESS in retirement than they once earned, and I know folks that spend much MORE. Decide what you want to spend when you stop working and then save to that number – regardless of what your paycheck used to be.
Still, the bigger issue with the chart is that the savings multiple targets seem woefully low. Assuming you earned $75K a year/planned on spending $75K, the suggested 10x multiplier at age 67 would only build a nest egg ($750K) that provides an annual ‘safe withdrawal’ of $30K, using the basic Trinity Study 4% recommendation.
Yes, the Trinity Study is just a rule of thumb or starting point, but $30K isn’t even close to $75K. And that’s at age 67. At age 60, which is much closer to the average age of retirement for most people (62), the suggested 8x multiplier would leave you with only about $24K in annual spending.
I would suggest anyone seriously looking at retiring should TRIPLE the savings they see on this chart. I’m not kidding. Especially if you are thinking of retiring 3-5-10 years early. That level of savings might be very difficult at age 30 or 35, as you are still early in your career, but by age 40, you’d better have your savings in HIGH gear.
As a personal point of comparison, our retirement nest egg at age 50 (just after I retired) was 30x our planned early retirement spending. I probably wouldn’t have even considered leaving work if I had much less of a multiple than that. A 35-40 year retirement horizon is just too long to not have saved adequately.
Chart Credit: CNBC

The relevant numbers for me did not pop out from the page until your last paragraph, “30x of planned early retirement spending.” My favorite, often rhetorical question to the CNBC numbers, “How was that measured?”
My own personal point of comparison. Retired at 49 with a 22x planned retirement expense. Yet, since no number is stagnant, savings are now 21x after a five year coaster ride. Snapshots appear minimally useful, trends are more useful. The ratio of income over expense allows change in the numerator and the denominator.
Thanks for the thoughts.
LikeLiked by 2 people
A 22x multiple is a little less than the Trinity Study’s 25x rule-of-thumb. Of course, no one knows your finances better than you. A comfortable retirement with significant discretionary spending allows one to adjust to what is needed over time. I’m guessing that about 2/3rds of our spending could be considered discretionary, making a 22x multiple very doable.
LikeLiked by 1 person
My wife and I decided to retire when a Deferred Comp Plan that paid out quarterly over 10 years commenced and the dividend income from a cash brokerage account matched the amount we earned from working.
We have not touched our self-directed IRAs or will be starting Social Security until both my wife and reach age 70. Our starting withdrawal rate was 2.67%, which is well below the Trinity Study 4% withdrawal rate. Our savings were 37X our income at the time we retired.
2.67% versus a 4% withdrawal rate means that despite the bad inflation and stock market, our income is staying ahead of inflation due to reinvesting some of our dividends and the boring stocks we focus on are still increasing their dividends.
The biggest expense item we saw drop was not receiving W2 Income that has Social Security and Medicare Taxes taken from it. Qualified Dividend income is also lightly taxed at around 15% and with REIT income you get to subtract 20% before calculating taxes.
However, the biggest expense item we saw increase was Health Insurance because we did not have an employer who provided a plan like yours. When I qualify for Medicare, I expect a $10,000 per year savings.
I agree with your assessment that the article’s assertion that your expenses will go down is incorrect. In my case, my biggest savings in the area of taxes and my biggest increase in Health Insurance just cancel each other out. The chart also seems especially light on savings during the early years which passes up the opportunity for the magic of compounding to do the heavy lifting.
LikeLiked by 2 people
“The magic of compounding to do the heavy lifting” is well-put. I didn’t include our MegaCorp pension or (eventual) Social Security in my 30x multiple. I’m about a 36x with my pension included (which I’m taking now). I’ve been paying 100% of our heath insurance for the last 6 years, too. Just eligible for the MegaCorp retiree plan this year. It lets me buy at about a $300/month discount.
LikeLiked by 2 people
Those who frequent this forum save to invest, manage their household expenses, and know their numbers. I bet everyone of us has very detailed expense and income spreadsheets. I believe it was Bowman Manifesto even had one that accrued for replacement of major household systems. That is how property managers manage their properties.
LikeLiked by 2 people
Yes – that was ThomH that had that wonderful ‘capital depreciation accrual’ system.
LikeLiked by 1 person
The wisdom is in your response, Chief. The only thing I find worthy in CNBC article is calling attention to saving in the first place. Americans need encouragement to save at all. If diligent and protracted, a portion of savings may become investment capital for long term. Investment (not merely saving) is the only method (other than lottery luck) to reach self-agency for achieving financial retirement goals
LikeLiked by 2 people
Younger people I worked with when I was close to retirement asked me what they need to. My response was invest to own yourself. Owning yourself is the best gift you can ever give yourself and will last much longer than any new car.
LikeLiked by 2 people
Agree – it is good news they’re encouraging saving, even if the benchmarks are too low. Maybe if people saw what they really need, they would be so paralyzed in financial fear they wouldn’t do anything. Then, the politicians would swarm in to “fight for their rights” with more financially dubious plans!
LikeLiked by 1 person
Two comments. First this was done by Fidelity and just shown by cnbc. Secondly, while I would agree that using the %4 rule would make this inadequate for retirement savings time if you then add SS on top of it, it wouldn’t be so bad.
LikeLiked by 1 person
Good point! The average Social Security benefit works out to about $20K/year.
LikeLike
Our financial industry is based on the sale of services (ie. fleecing sheep) instead of the actual accumulation of retirement assets for clients. IMO, the CNBC graphic (even considering the addition of SS income) is absolutely ludicrous and would have people eating cat food. It’s clearly insufficient considering any practical measure of retirement income. Sadly, (I’d bet) these types of graphics (ie. disinformation) are attempts to calm the large growing mob that is quickly approaching retirement age (drastically underprepared) having been misled for decades by those same financial advisors (ie. scrupulous sales people) called the financial industry.
(But hey…what do I know?! Keep listening to CNBC! I’m just a happy retired guy, who has ignored the financial industry for decades!) 😜
#enjoyingfatFIREat60x, #fleecersfib, #sheepeatcatfood, #toomuchsatireforoneday!
LikeLiked by 1 person
You nailed it – the CAT FOOD industry is behind this! 😉
LikeLike