
Just a quick post this morning. I wanted to share this data I just came across in the Wall Street Journal.
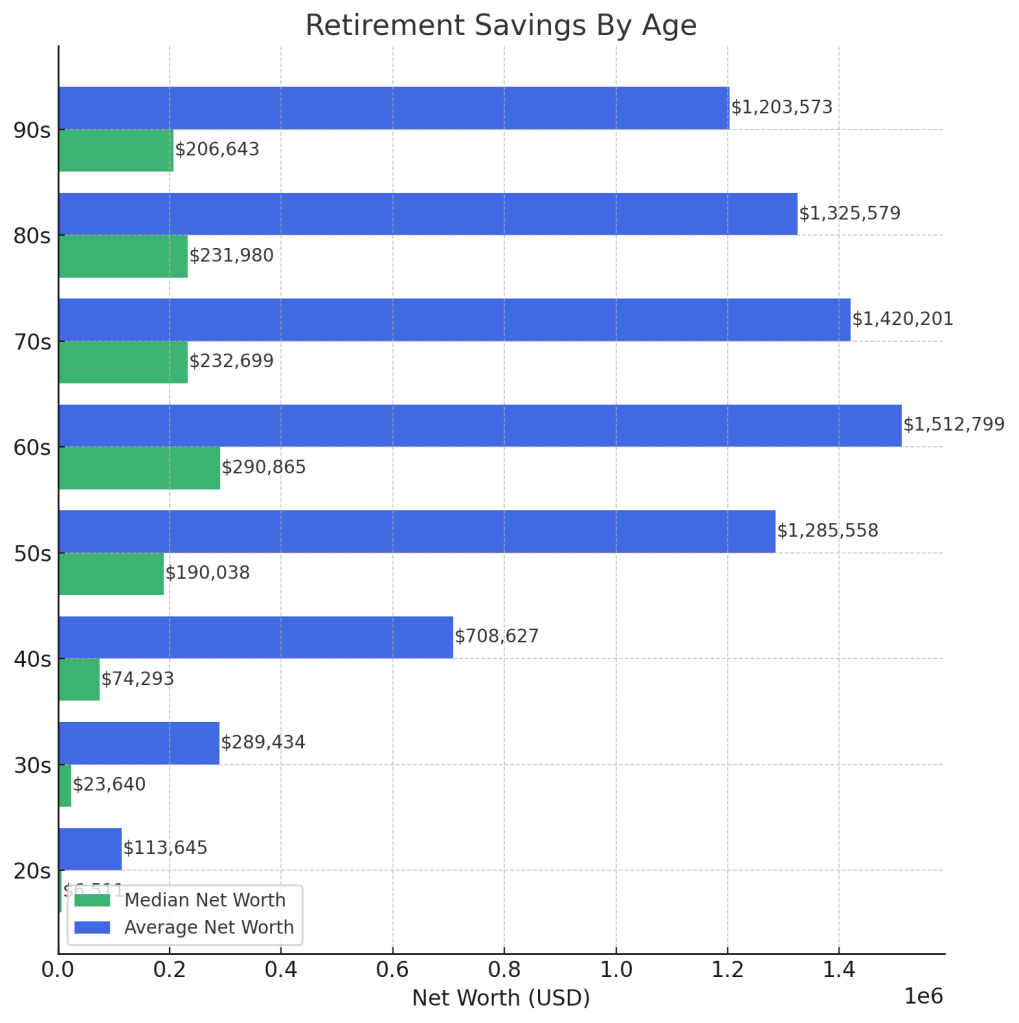
If you want to feel good about how your retirement savings are going, just compare your savings with these mean & median figures from across the USA. I’m guessing if you found your way to this site, you are running well ahead of the crowd at your age. (Remember, the smaller ‘median’ number in green is the amount 50% of other Americans are at. The blue ‘average’ is much higher because it is stretched up by the uber-wealthy).
Better yet, rather than feel smug, find someone you think needs help reaching these numbers and encourage them to get serious about their savings plan before another 10 years goes by. Every extra dollar they save today will payout in less work and more freedom & independence later.
Have a great weekend!

Notice that the retirement balances are peaking in the 60s and seems to be getting drawn down. I wonder if this is caused by retirees having to spend their principal in order to fund their retirements.
With a dividend investment approach we track both our Annual Income and Market Value. Since retiring six years ago both our Annual Income and Market Value have grown in lockstep to each other at 6.5% per year. 6.5% Annual Income increases helped us stay ahead of the inflation cycle we just had. I would have loved to have received 6.5% annual income increases while working.
One investment newsletter I subscribe to calls dividend increases a dividend magnet. Dividend increases may not be immediately recognized in the market value, but over time the market value will increase commensurate with the dividend increases. I am always on the lookout for stocks where the increase in market value is lagging dividend increases.
So far this year, electric utilities, especially the ones that are growing to power AI data centers are doing really well and are up about double the S&P 500 YTD Return. Remember that the S&P 500 is market cap weighted and right now the majority of its market cap is a function of technology stocks that are seen as AI plays. Electric utilities were seen only as an alternate to high yielding treasuries and were unloved. They bubbled to the surface when screening as having a combination of reasonably high current yield, good dividend growth rate and long term predictable track records.
LikeLiked by 1 person
We’ve been retired 9+ years and our total market value is much higher now than we retired – in nominal & real terms. I’m not sure exactly how much, but that would be an interesting exercise for a future post.
Yes – it certainly looks like the electric companies are going to enjoy a big wave of AI-fueled growth. The predictions for how energy-reliant the new technology is are very high. A lot of dividend investors are loving the capital appreciation they are seeing!
LikeLiked by 1 person
Definitely a good exercise running your return numbers and increase in annual income. Sounds like you are selling apples and have more crop to sell every year as your trees grow larger, instead of the chart above that depicts people cutting down their apple trees to sell firewood.
LikeLiked by 1 person
Good analogy! 🍎🍏🍎
LikeLiked by 1 person