

When I left the office 10 years ago this month, I never could have imagined the incredible good fortune our equity investments would benefit from over the full decade of our early retirement. As you can see below, S&P 500 returns over that period of time have average a hefty 14.1% with dividends reinvested!
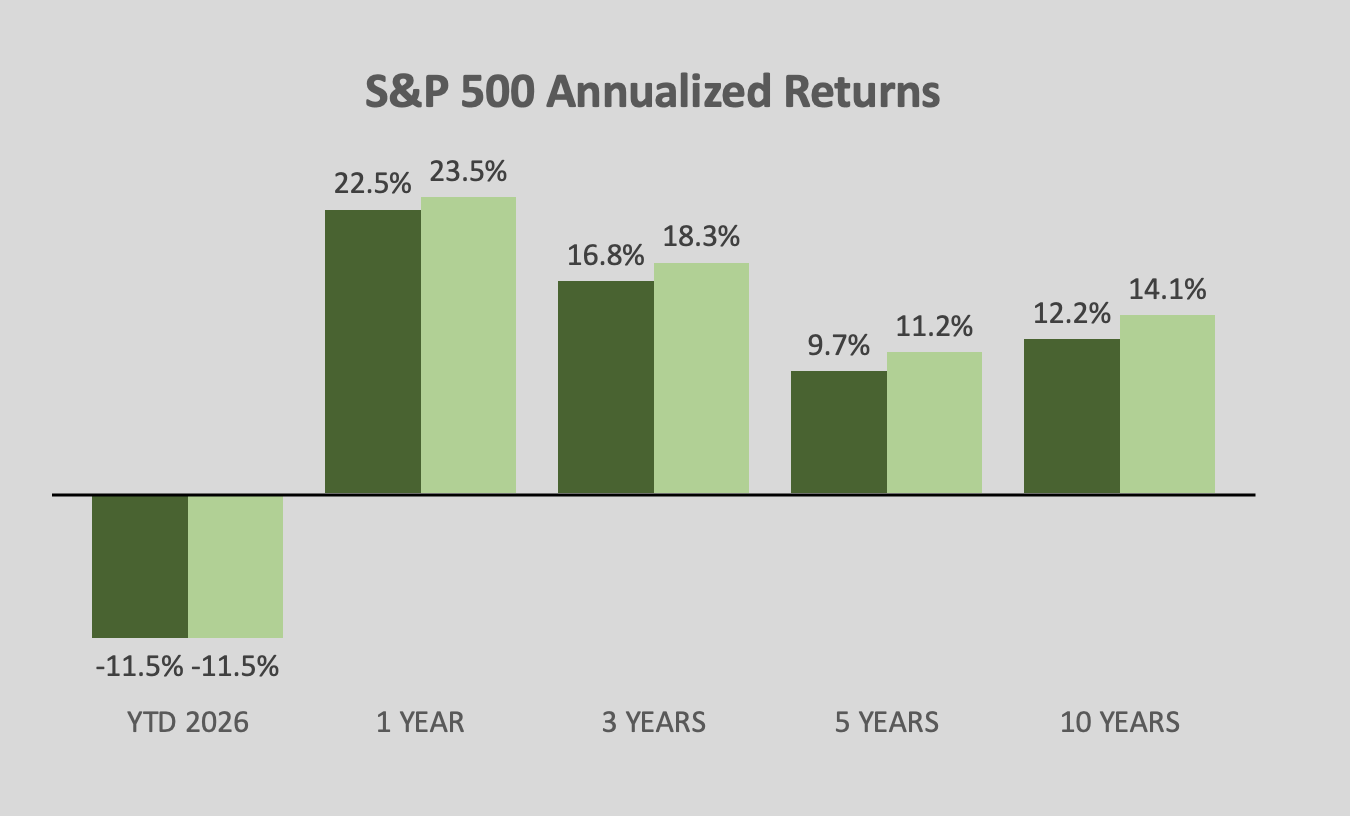
Our portfolio also includes bonds, real estate, and cash – but I always use the S&P 500 as the main gauge on our retirement portfolio dashboard. Our actual return is something less than that, but we have enough of our wealth in equities that the stock market carries most of the weight.
My early retirement spreadsheet also compares our current position with what we expected on April 1, 2016. At that point, we had a slight surplus (0.6 years spending) in our portfolio. That was a six-figure buffer. After a couple of rocky years – including one year with a bright red deficit – our surplus has steadily grown. It now stands at a remarkable 12.7 years spending.
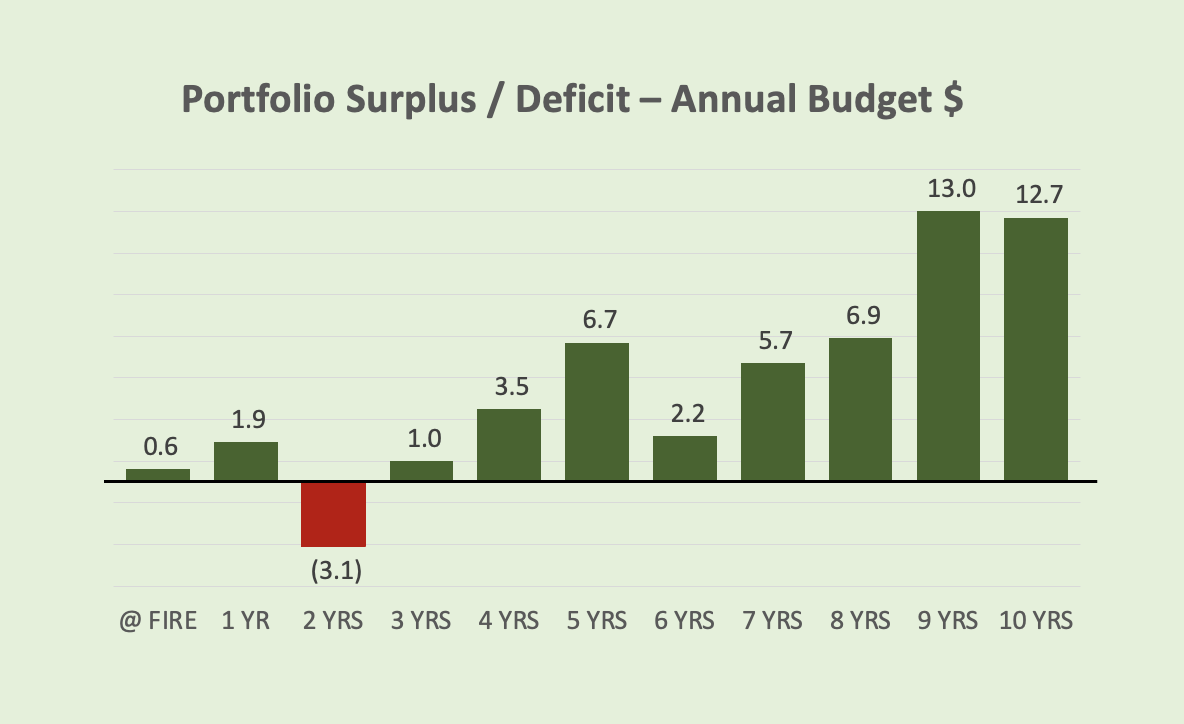
When I look at this chart, it’s incredible to me that after 10 years of not working – we have an EXTRA 10 years of spending in our current balances. It’s like we never stopped working and were still contributing earned income to our portfolio.
Still, we shouldn’t be surprised if there is suddenly a big set-back in the 4-5 years spending range. We’ve already seen that happen TWICE, although some of that volatility was a result of the extreme up-and-down of our MegaCorp stock options, which comprised a significant share of our holdings when we retired.
That said, those MegaCorp stock options were also the one BIG thing that helped us the most over the last 10 years. We sold at an average price of $57 over 6 years of retirement. Our goal was $51 and that small $6 difference meant an extra +40% return with the leverage that the options provided.
I closed them out in 2020 with a lucky move on St Patrick’s Day when the pandemic lockdowns hit the market.
To put that $57 price in context, MegaCorp stock started the last 10 years at $36, fell to as low as $29, and is currently at $38. (It actually peaked at $90/share in 2023, but that’s after our options expired).
Regardless, it’s been a great 10 years for our portfolio and we feel blessed for that. They say your investments are most vulnerable during the first decade of your retirement, so I’m hopeful that we’re heading into decade #2 with a very strong financial foundation.
How far ahead of your original FIRE projections is your portfolio?
Image: Pixabay

I can see that the main metric that you track has gone up by quite a bit. Please define 12.7 years of Portfolio Surplus? Are you counting cash and cash like equivalents such as short term treasuries?
Here are my numbers from five years of retirement. One of the main numbers that I track is the annual income that appears on the bottom of your brokerage statements. My annual income includes a deferred compensation plan that is a sinking fund that pays out over 10 years. It is invested in short term treasuries. I also include Social Security income which is currently being collected for my wife and still being deferred for me. We also have a taxable brokerage, self-directed IRA Accounts and Roth IRAs.
During the first 5 years we have withdrawn 2.5% annually. Our annual income has increased a compounded 14.7% annually. Our market value has increased 8% after pulling out the 2.5% to live on. The difference between annual income growth of 14.7% and 8% market value is due to rolling 401-k’s into dividend stocks and deferring Social Security claiming until age 70.
During Q1 2026, we have beat the S&P 500 Market Weighted Index by 10%. The equal weighted index is beating the market weighted index right now.
Our plan is to never draw down our savings to live and so far, so good.
LikeLike
12.7 = Our net worth is 12.7 years of annual spending higher than expected at this point. We could “double spend” for 12.7 years and still be where we expected to be at that point in our retirement.
Sorry if that’s not clear. Maybe it’s best to just use percentages. I don’t really track “income” – just what we have in net worth at the end of the year (after spending).
In percentages, we’ve earned a compounded 12.5% annually across our portfolio over the 10 years. We’ve spent about 5% per year, leaving the value of our portfolio to rise at about a 7.5% annual rate. Slightly lower numbers than yours, but for period that is an extra 5 years in length.
Great start to your 2026 performance. So far the drag from Trump’s tariffs and war haven’t been too bad on our portfolio. I’m not a fan of his economic policies or foreign affairs. My portfolio isn’t either.
We don’t have any plan to “never draw down our savings”, but at this point, it seems like it would be pretty difficult. We don’t seem to have big things to spend on right now – but, you never know!
LikeLike
I think I understand now, it sounds like you set a target income and withdrawal rate to achieve it and the market cap that is required to support.
My dividend investing is a value approach where I am shopping for current yields over 4% with long term growth over 4% for a safe stock where the business hasn’t fundamentally changed. The stocks that fit this profile are out of favor, hopefully temporarily. The trick is avoiding businesses where something has permanently changed. You want to avoid owning Blockbuster when Netflix is killing their business model. It normally lags when the market is hot and leads when the market is cold.
Late last year we backed up the truck and loaded up on Verizon, Chevron, Canadian National Resources and electric utilities that serve datacenters. We actually oversubscribed to a rights offering for a closed end fund that specializes in utility stocks. I actually had some communication with the rating service I use. They thought the play was utilities switching to what they thought is cheaper green energy. My input as an electrical engineer was that green energy is occasional energy, so it still requires conventional backup generation with raises the cost. Datacenters are energy hogs. Reshoring manufacturing is also going to drive demand. These plays did really well.
Two of our long-term holdings, Home Depot and Microsoft had a bad quarter in terms of market cap lose. Microsoft was down 25%. Ironically, after their recent drop, both Home Depot and Microsoft were on my rating service’s current buy list of 8 stocks. HD and MFST are not nearly the bargains they were when they were super out of favor in 2009, as they both had a current yield of 4.5% back then.
Dividend investors care more about annual income and safety. The market cap can up or down according to how Mr. Market is feeling. Over time though the market cap is propped up higher as other buyers are willing to pay up for the income stream.
LikeLike
Using AI, I see no companies with a 4% revenue CAGR over 5 years and a 4% dividend yield right now.
The ones that are close include GIS, but they’ve fallen short on revenue growth. When I was there, we targeted a 4-5-7 model. 4% volume growth, 5% net sales growth, and 7% operating profit. With a 4-5% dividend, that would be 11%-12% total shareholder return and – if done consistently – it would make us the “Company of Champions” among our peer set. We did it for about 10 years.
A lot has changed in the last 14 years since I reached my “Rule of 70” retirement. Given acquisitions & divestitures, I’m not sure where they are at, but I see they have a 2% net sales CAGR over the last 5 years (with declines in 2024 & 2025). I don’t think they are in a Blockbuster Video situation, but it’s certainly a challenging environment.
LikeLiked by 1 person
I ran a screen on the rating service that I subscribe to for 4% current yield and 3% growth. Here are some names that bubbled up.
PAYX Current = 4.72% Increase = 10.2% Safety = 70
AMT Current = 4.11% Increase = 5.0% Safety = 78
FNF Current = 4.47% Increase = 4.0% Safety = 70
PRU Current = 5.75% Increase = 3.7% Safety = 75
NNN Current = 5.55% Increase = 3.1% Safety = 80
BEN Current = 5.55% Increase = 3.1% Safety = 70
Here is GIS. Current = 6.63% Increase = 1.7% Safety = 80
GIS 5-year average dividend growth rate is 4.1%. If the company can get their growth back to their five-year average, you are looking at at 6.63% + 4.1% = 10.73%, plus there will be some increase in market price that will push the dividend down to its normal range. Easily a 12% gainer. The key is can the company revamp its product offerings to get growth going again. Really aligning with MAHA will bring customers who are more quality than price conscience.
Late last year I picked up VZ, CVX and Electric Utilities that screened similar. Back in 2009 I picked up HD when it was paying 4.5% current yield and they were increasing their dividend 20% per year for around the next 10 years. Also picked up MFST when it was yielding 4.5% and was increasing their dividend in the high teens. HD had the housing debacle and a bad CEO to fire. MFST was seen as a has been software company. They were switching from licensed to subscription software-as-a-service which caused short term cavitation in their earnings but set them up for predictable growth. Office 365 is the clear-cut winner in their space, and the platform is growing to do more including identity management, virtual meetings and telephony.
I used to do the screening manually using free services. I found that using a subscription service saves time and has the value add of their CPAs combing through companies’ financials to identify dividend cutters before they cut.
LikeLike
We have been traveling so I am getting caught up on the blog posts. I track monthly our financial net worth not including real estate which is our condo where we live. I believe in buying real estate to control long-term living expenses and if you or your heirs benefit from appreciation, so be it.
My portfolio has increased 88% from retirement in September 2019 until today. We have pulled very little as in less than 1% out as pension, social security and consulting fund life.
What I was shocked to learn is that year to date I am up 10.2%. Much of that is due to tech especially Lumentum LITE which has been on a tear. Cost basis is $45/share and Friday it closed at $897. We sold $100,000 worth of it in February and since then our position is increased more. Yes, this is highly overweighted in our portfolio, which is why we dumped a portion. We have been very fortunate to have some strategic purchases and held them in the Benjaman Graham style. Money is made in securities or real estate on the buy.
We have surpassed all goals from a financial standpoint. As one reads, the first million is the hardest and when you get to a certain point small percentage moves can be quite lucrative.
Yes we are giving more to our kids this year.
LikeLike
Those are fantastic results. Both your portfolio growth since 2019 (we’re up 63% since then, net of living expenses) and your position on Lumentum. I hadn’t heard of that company before. Looks like it is a San Jose-based company involved in technology for AI data centers. Up from $67/share this week last year to $897/share now. Incredible! What led you to invest in that company?
LikeLike
My broker at Raymond James. He also has me in Broadcom AVGO, Itron and some other stunning securities. I don’t trade much. He handled my parents accounts over the years and my brother and sister have accounts with similar returns.
When you don’t need to draw money out of the account, you can wait out downturns or wait until the street discovers your gem.
You might recall that I picked up 3M on the cheap and waited a few years and had a great return. Boring well managed firms are sometimes ignored and as Klaus knows, they can be gems in disguise paying decent increasing dividends and then have a capital gain explosion.
LikeLiked by 1 person
That’s great top have a trusted broker. Just on that one pick of Lumentum, he’s worth whatever you are paying him!
LikeLike